Amazon Trends and Predictions for 2021
Editor’s Note: This is a guest post written by Pooja Kothari, Content & Community Specialist at DataHawk.
2020 has been really tough for everyone, disrupting most business industries in one way or another. There have been winners and losers, and Amazon was definitely among the first kind.
In fact, Amazon is one of the few businesses that experienced a significant boost from the COVID-19 pandemic. Amazon’s Q4 2020 earnings were $125.6 billion, a 42% increase in earnings.
However, the year 2020 has coerced most online businesses to a rapid evolution: more advertising, different consumer habits and different sellers.
So, what are the top trends that Amazon experts are predicting for 2021? How are Amazon Categories performing in 2021 and how can you be prepared for the several challenges that you could possibly face in 2021?
Here’s DataHawk’s recent report with key data insights for 2021 you should know.
1. Top Selling Categories in 2021
At DataHawk, we analyzed the sales performance of the top 20 categories in the U.S. across a sample of our clientele. We summed up our estimated monthly sales per category.
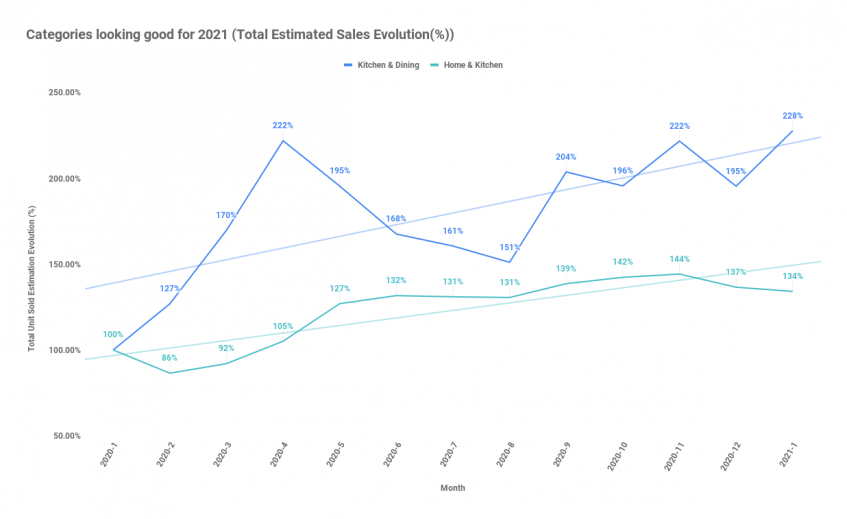
Here’s an exclusive, filtered view of some categories with highlights based on their nature of evolution.
Best bets for 2021 → Home & Kitchen – Kitchen & Dining


It comes as no surprise that the Home & Kitchen is the most popular category on Amazon. In fact, Amazon U.S. saw stupendous sales activity during April- May 2020 & September 2020; Kitchen & Dining witnessed an estimated evolution from 170% in March to 222% in April (the highest peak).


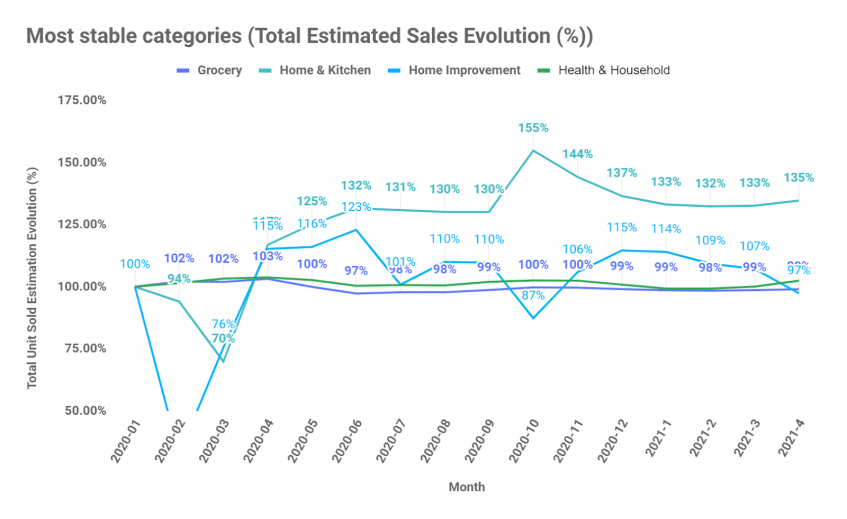
We saw in the first week of April, how Home & Kitchen and Home Improvement are growing in their rankings attributed to their estimated sales and can be seen as the most selling categories for the year. The Grocery category and Health & Household category are seen to be the more stable categories with slow, but continuous growth. The graph shows a steady month-over-month increase for the four categories. In addition, it’s predicted to follow the trend, seeking remarkable growth in 2021.
There’s no doubt that the COVID-19 pandemic intensified this trend and completely changed the way consumers interact with brands and retailers.
- Visits to Amazon’s Home & Kitchen category rose 5% YoY in Jan – Apr 2020
Pro Tip: If the categories you want to sell on seem too competitive and oversaturated, it’s essential to weigh your chance of landing on page one of Amazon’s search results.
What you could do best is dig deeper into various subcategories to find the best spot for your product using Amazon market research.
Why is Home & Kitchen a go-to category for sellers?
- Fewer restrictions: Selling in the Home & Kitchen category on Amazon is more comfortable than others because it doesn’t restrict new sellers from listing. See restricted categories here.
- Most common products: The category is home to products that everyone uses.
- Less number of regulations: Sellers need to follow Amazon compliance and federal regulations; for instance, for food products, they must have an expiration date, toy sellers were restricted during Q4, etc.
Whereas Home and Kitchen is less complicated in terms of regulations, making it easier for sellers to sell in the category on Amazon.
- Easy to manufacture: Finding a supplier to manufacture a kitchen item is relatively easy compared to other types of items. Search through kitchen supplies on Alibaba, and you’ll see how easy it is to get almost any kitchen product you can think of.
2. How Do Sponsored Slots Weigh Among Total Search Results?
Amazon advertising has become increasingly important every year.
The rollout started in 2019 when Amazon added a number of programs within the Amazon advertising platform, for instance, new targeting options, increased access to display and video ads, and several recent reports and data points.
As a result of this evolution, we saw a reduced number of organic slots on the Amazon search engine results page (SERP). Not only that, but Amazon also added ad slots and placements for paid search, editorial recommendations, Recommended articles, and more.
Amazon Ads is evolving rapidly, and while the platform is still fundamental compared to Facebook or Google Ads, it’s slowly becoming comparably sophisticated.


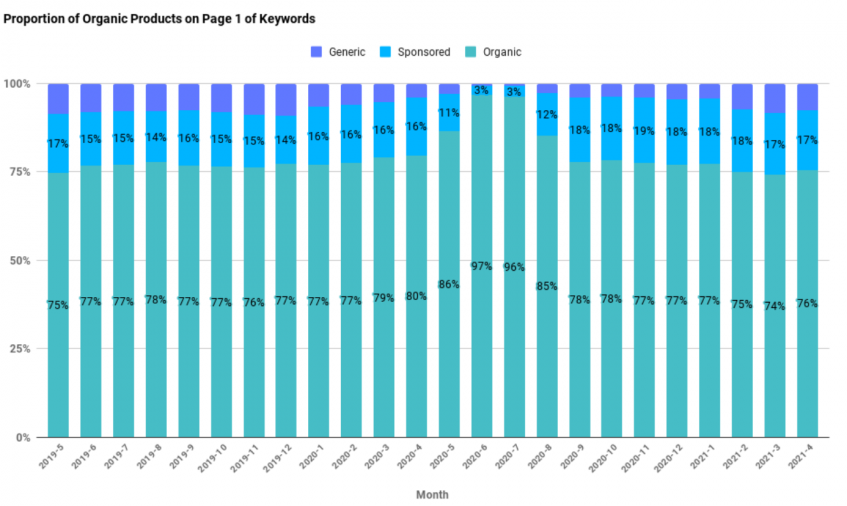
In this chart, we’re looking at the proportion of organic/sponsored/generic products on the 1st page of more than 50K keywords.
The chart represents that the proportion of sponsored and generic (other featured products) products has been continuously increasing through 2020 and the beginning of 2021. While in June 2020, the organic ad slots had a 97% share, by August 2020, it dropped to 85% & to 77% in January 2021, delineating a stable decrease. However, from there the proportion of organically ranked products is stabilizing around 74 – 75% on page one on Amazon U.S.. It looks like amazon is slowing down their process of having more and more sponsored products for now.
We can expect the competition to continuously rise within the sponsored ranked products space in 2021.
With the enhancements in Amazon ads and ads reporting, it is essential to understand the science and art of Amazon Ads to make your ad campaign optimization better to maximize your potential sales.
Have you ever attempted to drive external traffic to your Amazon listings?
Amazon Attribution dashboard on Amazon is specifically designed to do just that. It helps you grow your business by optimizing customer experiences away from the platform.
3. The Trajectory of Delivery Speed in 2021 vs. 2020?
Over the past couple of years, Amazon has been leasing planes to build its fleet. With 11 jets from Delta and WestJet airlines to boost its growing delivery network and get orders to shoppers faster, it’s the first time it has purchased planes for its delivery network.
With the continuous efforts to make the delivery process smoother and faster and restore fast shipping and reduce dependency on other carriers, it was interesting to analyze the delivery speed in 2021.


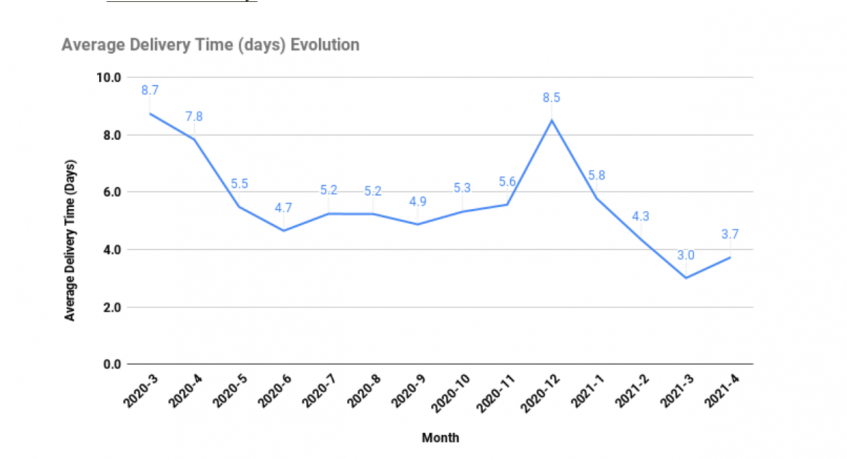
In the chart above, we are looking at around 150K products throughout the last 14 months.
The first peak was seen in March due to Covid when the delivery time was more than 6-7 days. Another peak in December 2020 is attributed to the Christmas gift folie, where due to the massive number of orders, the delivery time was increased. The delivery time then reduced to an average of 5.5 days in January.
However, 2021 seems a lot better than 2020. The 1st semester itself has shown great improvement. We can see a continuous drop in the average delivery time since January 2021. The average went from 5.8 days to 4.3 to 3.0 in March. Really impressive!
As expected, the delivery time is continuing its decrease with impressive months of March & April.
Avg(2020 first semester) = 5.93 days
Avg(2021 Jan + Feb) = 5.34 days
Avg(2021 Jan + Feb + Mar) = 4.3 days
The average delivery time has decreased by 11% in Feb 2021. This translates into a 14 hours win for the delivery time average. The significant change can definitely be seen as a good sign for 2021.
Payoneer X DataHawk Team Up to Give Sellers a Boost
Payoneer and DataHawk have teamed up to offer DataHawk users direct access to Capital Advance Grow, a working capital solution by Payoneer that allows sellers to expand and boost their Amazon business.
Payoneer’s Capital Advance enables you to receive funds within minutes so you can quickly grow your brand with increased marketing investments, buy more inventory for peak seasons, and expand into new products and markets.
To learn more on how to get a boost with Payoneer’s Capital Advance, click below.
Conclusion
All in all, the previous year did throw a zillion challenges at Amazon, but Amazon is looking all set to leverage new opportunities and persistently innovate what’s already working for them. They’ve set standards high for brands & sellers, and 2021 will be a year for more focus and innovation.
With that said, we’re excited to see what 2021—and Amazon will bring us!


